Ever-increasing amounts of data about our transportation system are becoming available to transportation planners, and analysis of this data is revealing patterns and informing critical infrastructure decisions. Moving Ahead for Progress in the 21st Century (MAP-21), the current federal transportation law, places increased emphasis on performance management within the Federal-aid highway program and transit programs, and requires use of performance-based approaches in statewide, metropolitan, and non-metropolitan transportation planning. As a first step to implementing a performance based planning process (PBPP), ACOG is currently determining appropriate congestion measures for the Central Oklahoma region which will be reported in the Congestion Management Process. The goal of the CMP is to outline the state of congestion in the Central Oklahoma region and develop recommendations for managing traffic congestion based on detailed data analysis, that in turn will impact proposed roadway construction projects included in the Transportation Improvement Program (TIP) and the goals and objectives identified in what will be Encompass 2040, the region’s next long-range transportation plan.
In a major leap forward for data availability, the Federal Highway Administration (FHWA) has partnered with HERE.com to provide travel time data to states and metropolitan planning organizations (including ACOG) for all roads on the National Highway System (NHS). The total length of the NHS in the Oklahoma City Area Regional Transportation Study (OCARTS) area is roughly 609 miles of roadway.
Collected anonymously from smart phones, fleet tracking equipment, and other GPS-enabled devices, this travel time data records the amount of time it takes for vehicles to traverse links in the region’s road network every five minutes; when congestion occurs on a link, its recorded travel time increases dramatically. Using the distance of the links, this elapsed time can be converted to speed.
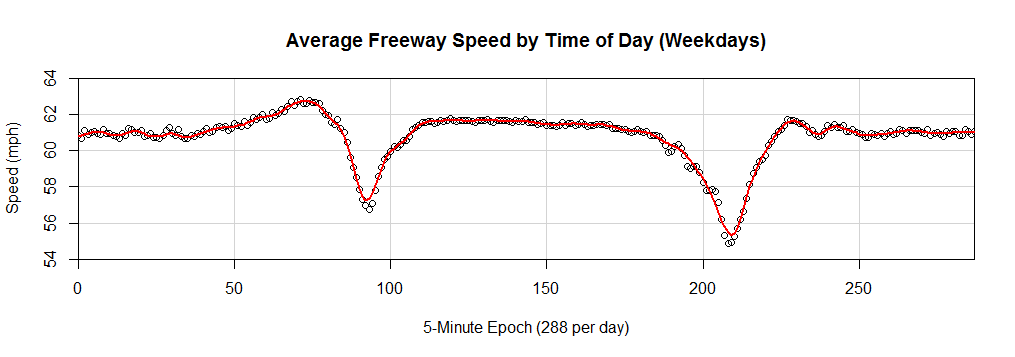
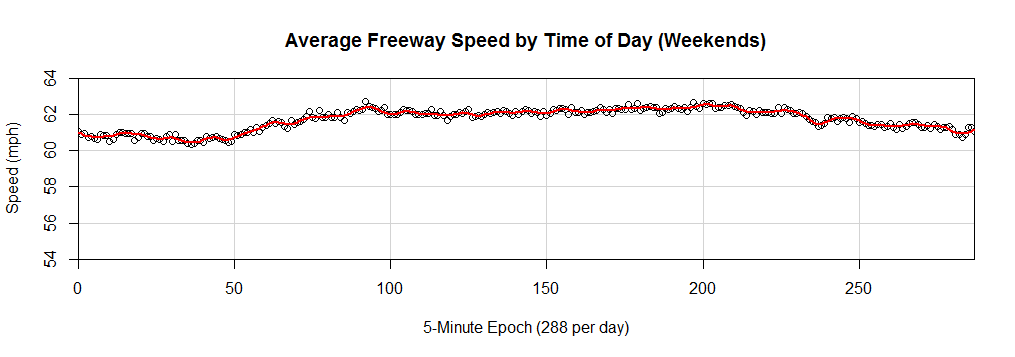
This dataset currently contains travel time data from July 2013 to March 2014, with new data being added monthly. Even when clipped to the OCARTS area, a month’s data is roughly 2-2.5 million records; the database contains just under 20 million records for the nine months it currently covers. The temporal and region-wide nature of this data provides a much more complete picture of the region’s traffic than has ever been available using traffic counts or earlier GPS travel time surveys, and will therefore be able to feed richer analyses. A quick example of this in action is an analysis of speeds on regional freeways. Averaging all speeds on freeways for each five-minute interval on weekdays and weekends reveals an obvious pattern: on weekdays, the average speed on regional freeways declines during morning and evening commute times, but on weekends these dips do not occur.
Travel Time Index
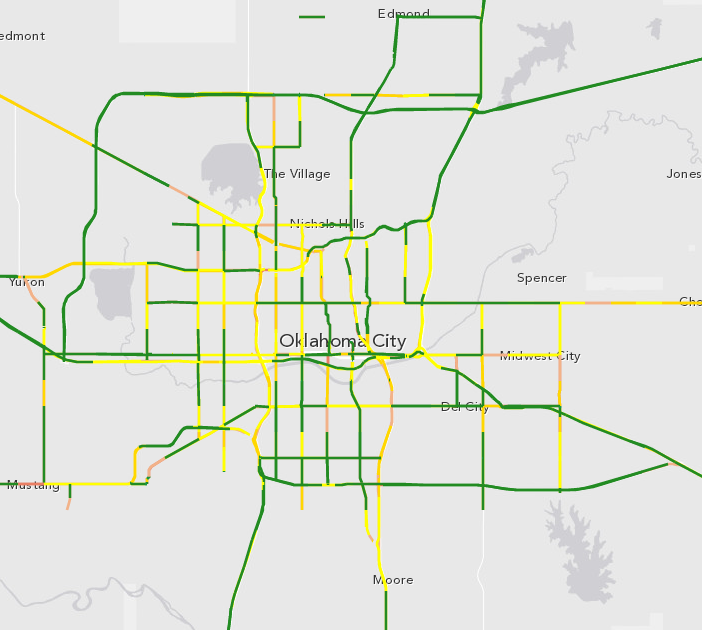
In an effort to quantitatively measure the extent of congestion on the region’s road network and identify congested corridors in need of attention, the Travel Time Index (TTI) and other performance metrics have been calculated for road links in this dataset. The TTI is calculated by dividing the average peak travel time by the average free flow travel time. Peak travel times are those that occur between 7 AM and 9 AM and between 4 PM and 6 PM on non-holiday weekdays, while free-flow travel time is derived from travel times that occur between midnight and 6 AM on all days, capped at 65 mph. A TTI around 1 indicates that peak travel times are roughly the same as free-flow travel times on that link. In simpler terms, that link is not experiencing congestion. TTIs above 1 indicate that peak travel times are slower than free-flow travel times, or that the link is experiencing congestion. The interactive ArcGIS Online map below displays the Travel Time Index for all roads on the enhanced NHS in the OCARTS area. Click the individual links for specific Travel Time Indexes and more travel time statistics. Note that this dataset is directional (i.e. one link exists for each direction of travel.)
Since more data is added each month, this and all other analyses will benefit as the pool of available data grows. Additionally, other analyses including but certainly not limited to seasonal traffic variation, road construction, traffic incidents, and weather events are possible with this dataset and will occur in the future.